Final Table Payouts
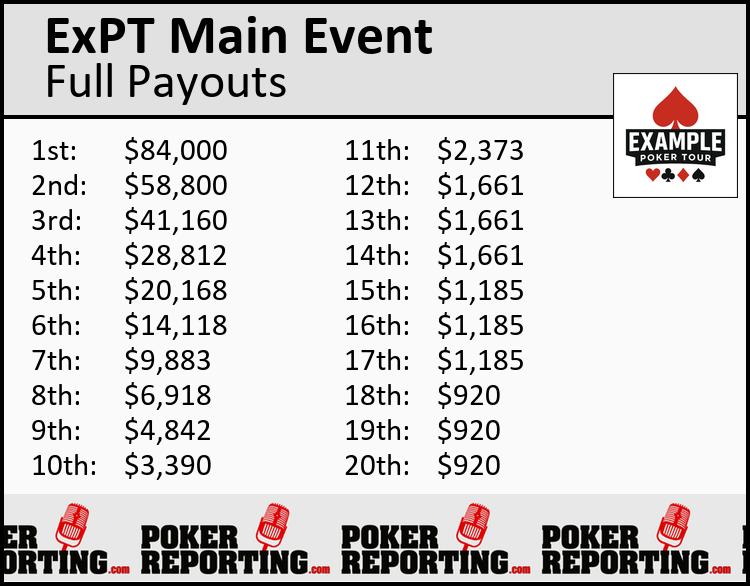
The graphic above is generated by Chronicle. You just provide the data, which you can do by uploading a spreadsheet from PokerAtlas, filling out your own spreadsheet, or just fill in text directly either by pasting or just typing them in, and Chronicle does the rest, generating a professional graphic with the logo of the tour and the venue. If there is only one logo, Chronicle puts it at the top. You can also download this graphic and use it anywhere you like, and automatically post it to your social media platforms. There is also space for a second image and another text box. Whatever you put in those boxes will be styled appropriately by Chronicle. You can also upload your own image if you want to just take a screenshot from the tournament software you are using and post that.
The image above, as well as a similar image that is generated for chip stack updates, will automatically use your colors and logos. If you don’t provide a second logo, it only uses your logo on the top. Here’s an example of that when we use our software on the PokerAtlas Tour.